How does pitch change with blowing pressure?
Quiz: When playing a melodica, which of the following graphs best represent(s) the relationship between blowing pressure and the resulting pitch of the note (assuming no intentional note bending)? And is it the same or different across all the reeds?

Graph (A): pitch is independent of blowing pressure (unaffected by it)
Graph (B): pitch increases as you blow harder
Graph (C): pitch decreases as you blow harder
Graph (D): pitch increases as pressure increases, then decreases as pressure continues increasing
Graph (E): pitch decreases as pressure increases, then increases as pressure continues to increase
Graph (F): some other relationship between pitch and pressure
Let’s say I am really particular about playing in tune, and I want to do the best tuning job I can do. The standard procedure for melodica tuning is to get an electronic tuner, play each note and record the degree to which it is sharp or flat, take apart the instrument, remove material from either the root or tip of the reeds you want to change the tuning of, reassemble it, play it again, and hope it sounds better! That’s how I started off. But once I started using my melodica tuning software, I started to notice some important subtleties that were affecting my tuning. There was a source of error affecting the repeatability of my readings- for example, I would play a C#4 and my software would tell me it was 7 cents sharp. The next time I played it, it would tell me I was 4 cents sharp. Then I noticed that this repeatability error occurred more so for some notes than for others. It seemed as though the pitches of some notes were more stable than others as I took my measurements.
I began to suspect that I was the source of error- meaning that there was something that I was doing a little differently each time I took my pitch measurements.
What might that be? Well, I knew I was pressing the same key, and blowing into the same tube… but what other factors was I not holding constant? How about volume? airflow? pressure? I had no good way of telling. I decided to try using sensors to test the hypothesis that these were factors.
I already had a volume sensor- my software uses a microphone, and it’s trivial to measure the amplitude of the incoming signal. But as any recording engineer knows, this signal varies wildly with factors including distance from the microphone, type of microphone, microphone gain, etcetera. So this would potentially introduce its own set of errors.
Airflow can be measured in a number of ways, including wind vanes, floating-ball flowmeters, and hot-wire anemometers. I purchased some flowmeters, after doing some quick tests to estimate the flowrate range I’d need (measuring how long it took me to exhale into the melodica and dividing that time into my estimating my lung capacity!). I found that a typical blow required somewhere between 20 and 30 SCFH (static cubic feet per hour). But I wanted an electronic sensor so I could take the data automatically (since there would be many readings to take), and this was going to require more time or money than I wanted to spend.
Pressure can be very easily measured with electronic pressure sensors, so I decided to start there. To get an idea of what pressure range I’d need, I took a length of clear plastic tubing, bent it into a U-shape, poured some water into it, and blew into one end with about as much pressure as I would normally feel when playing a note at medium volume. The water rose a few inches in the tube. “Inches of H2O” is actually a standard unit for measuring pressure! (1 inch of H2O = .036 pounds per square inch = 249 Pascals.) So, I went looking for sensors with a maximum reading of at least several inches of water. I purchased this one. Then I 3D printed a custom tube fitting with a small side port to connect a short piece of tubing between it and the sensor (so the sensor could read the pressure inside the blow tube). Then I upgraded my melodica tuning software to read the sensor and display the pressure reading in real time. This gave me the ability to read and display both pitch and pressure- basically allowing me to generate pitch vs. pressure plots as in the image above.

So, did you take my quiz? What was your answer? Was it, by any chance, “ALL OF THEM”? If you’ve read this far, please watch this video and see for yourself.
Each frame of the image below represents the pitch-vs.-pressure graph for each note of my Hammond Pro 44HP melodica, from lowest to highest. I was both extremely pleased with the information that this test yielded, and fascinated and troubled by the results!
Why on earth does the data look like this?
I would think that any melodica player, who cares about playing in tune, would have hopefully answered ‘ “A”- blowing pressure has no effect on pitch.’
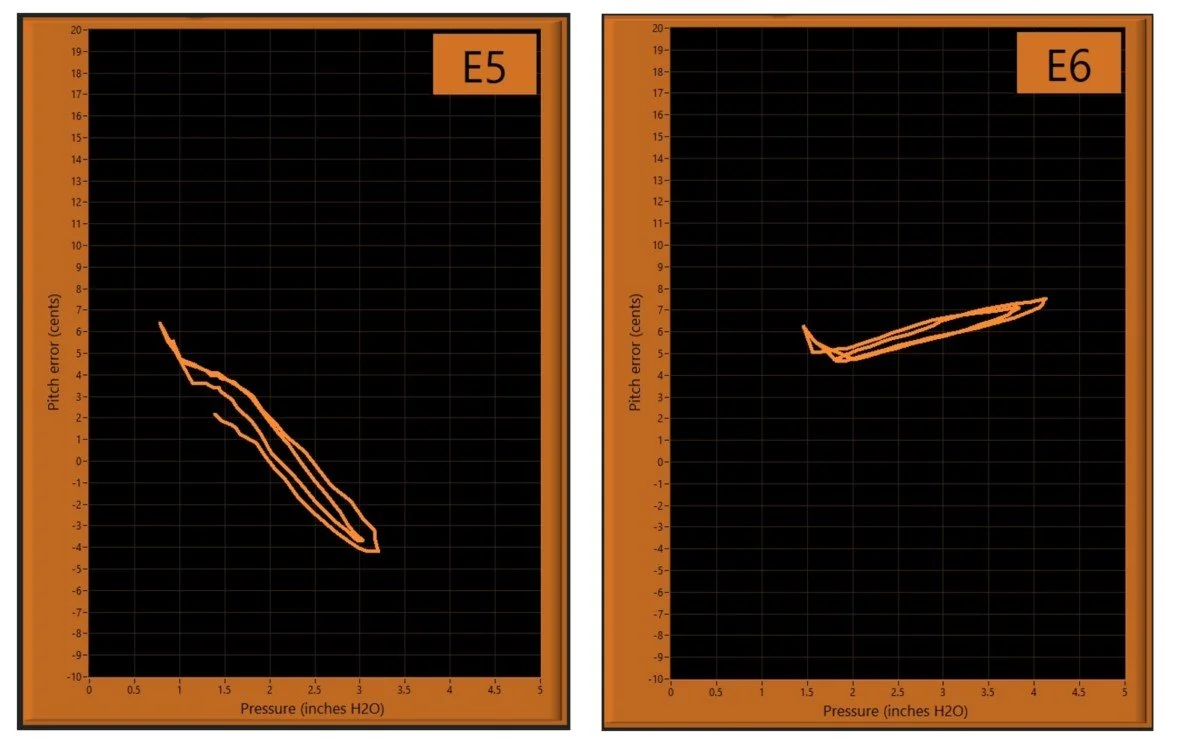
This is basically true- for SOME of the notes on my instrument- like D6, F6 and G6. But look at all of the other shapes that appear. Some notes, like G3 and B4, drop steeply in pitch with the strength of blow. Others, like D#6, go a little sharp as you blow harder. Let’s say I want to play a chord- specifically, the octave interval formed by notes E5 and E6. Each note gets the same pressure because they share the same air chamber. One goes flat as I blow harder, and the other goes sharp as I blow harder! I might be able to tune these two notes to precisely the same pitch- but ONLY AT ONE BLOWING PRESSURE.
Even more interestingly, these graphs show that many of these reeds exhibit hysteresis- they behave differently depending on whether the pressure is increasing or decreasing. The result of this property is the area enclosed by some of these graphs. This affect shows up really clearly in the above video- it almost looks as if I’m doodling on the chart- but all I’m doing is blowing!

WHAT IS GOING ON HERE???
Stay TUNED!
Possible Next Steps
This study raised more questions than it answered! It’s also generated a bit of a buzz amongst fellow melodica geeks. These questions include:
WHAT IS CAUSING THIS? Reed properties? Reed chamber properties? Resonances? Anti-resonances? Back pressure? Airflow changes?
What do these graphs look like on new vs old reeds? Wet vs. dry? Different melodica models?
Why don’t accordions suffer this problem? Or do they?
What physics are involved here?